
Animated data map shows where UFOs like to hang out
 © press
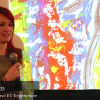
The UFO sighting graphic was created by brain child MBS candidate Christian Pearson, who used a web-based softaware and data collected from the UFO reporting centre. The map is part of Quanbait which is a visual story telling map that highlights the economic, social and political issues.
Pearson says about the Map “was a fun way of conveying the point that beautiful data visualisation can provide deep insights,”
For many UFO’s enthusiasts this map could become the holy grail, the map shows that sightings seem to jump towards the 1950s and 1960’s and the cold war era, this backs up many theories that there was many more UFO sightings because alleged aliens where concerned about the use of nuclear weapons, with many sightings seen in Military Airforce bases including Rendlesham Forest in the UK.
Sightings in the United States seem to correspond with the C.I.A’s U-2 program which was a Cold War air surveillance active from 1954 to 1974. The program saw the C.I.A test spy crafts at the famous area-51, the notorious Nevada facility which became know around the world for Alien Conspiracy theories. Pearson also adds that there are better data records of more recent sightings.
The general assumption that UFO sightings are mainly seen in rural areas away from the big cities, a myth that this map swipes away rather quickly. Pearson adds “The map clearly shows large clusters of reporting in urban areas,”


Leave a Comment
You must be logged in to post a comment.